Stock Buybacks: 2021 Trend Report
Analysis from VerityData examining 2021 corporate share buyback trends at U.S. companies.
Table of Contents
In this article, featuring highlights of a Buyback Trends report from VerityData | InsiderScore, we examine quarterly buyback data and identify market, index, and sector trends related to corporate stock repurchases. Note: This article is an excerpt of an exclusive report for VerityData | InsiderScore customers.
Want access to insider research reports, data, and analytics?
Request VerityData Trial >>
Stock Buybacks: 2021 Macro Trends
In many ways, 2021 set a new high-water mark for corporate buybacks.
Record Buyback Volume in Q4’21
Buyback volume for U.S. companies in Q4’21 was $289.8B, a 10.3% sequential increase and a 110.5% year-over-year jump. Buyback volume contracted significantly in 2020 as many companies conserved cash during the pandemic. Volume recovered to pre-pandemic levels in Q2’21, set an all-time high in Q3’21 and continued to surge higher in Q4’21. For the year, buyback volume totaled $936B, a new record.
S&P Buybacks Rose 9%, Russell 2000 Up 17%
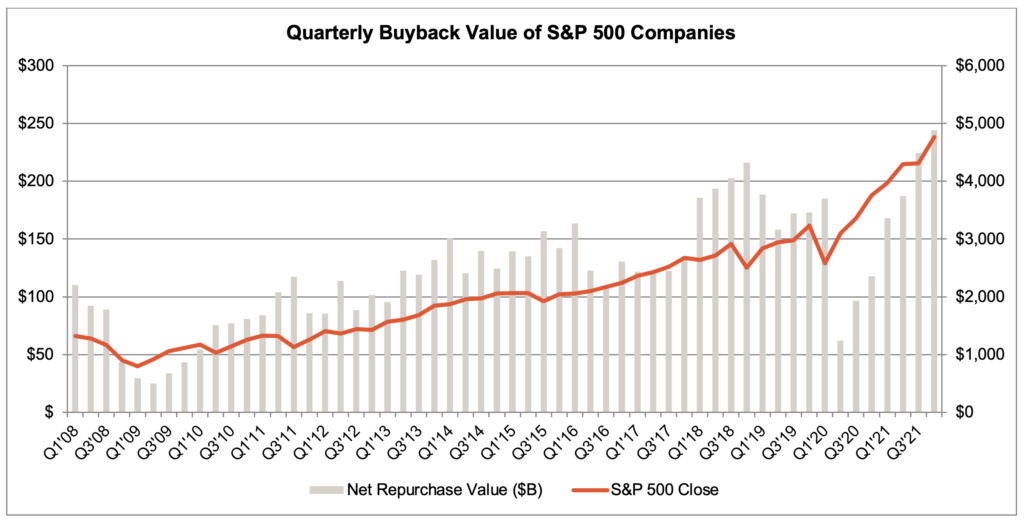
The aggregate buyback value at S&P 500 companies increased 8.8% sequentially and soared 109.1% year-over-year to a new record high of $244.1B. Those buybacks accounted for 84% of all buybacks, lower than the average of 89%.

S&P 500 companies accelerated buyback volume in 2018 immediately after the Tax Cut & Jobs Act went into effect. Volume moderated in 2019 to about $187B per quarter then dropped significantly in 2020 during the COVID-19 pandemic. Q3’21 set a record by surpassing the Q4’18 prior peak and the volume increased further in Q4’21.
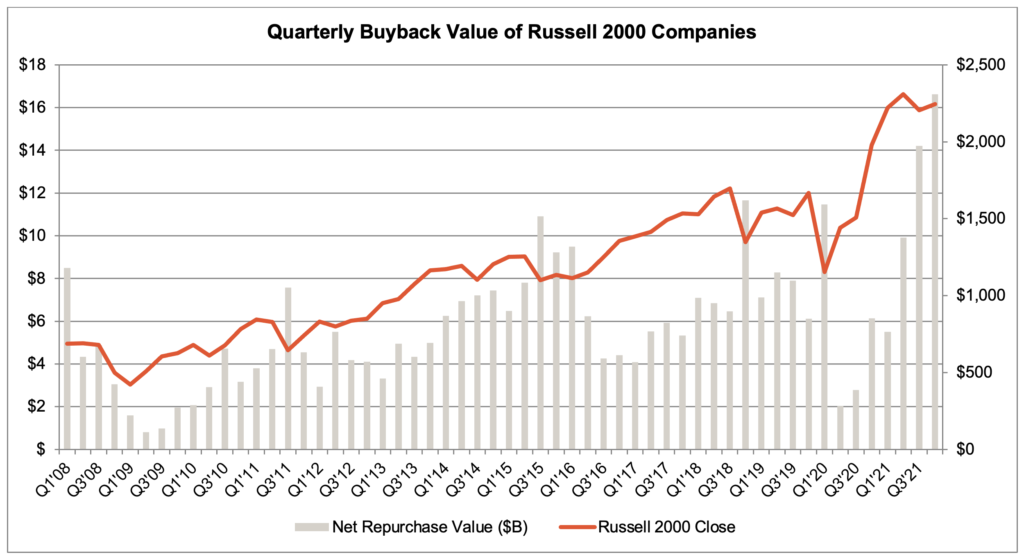
Russell 2000 buybacks rose 17% from a quarter earlier to a record $16.6B. Note that small-cap companies as group have been more opportunistic with repurchases than large-cap counterparts.

Forty-one Russell 2000 companies bought back at least $100M, nearly 4X the norm. Q3’21 saw 29 Russell 2000 companies buyback at least $100M while twenty-four did so in Q2’21. The prior two quarters were in-line with the norm.
As Percent of Market Cap, S&P 500 Buybacks Remain Below Average
The $244.1B dollar value of buybacks at S&P 500 companies was equivalent to about 0.60% of the index market cap, up from 0.59% in the prior quarter. The rise in buybacks therefore barely kept up with the rise in valuations for large caps in Q4’21. The average buyback per quarter since 2011 is 0.70% and the 25th percentile mark is 0.61%.
3% Increase in Number of Companies That Repurchased Stock
A total of 1,087 companies repurchased shares in Q4’21, a 3.0% quarter-over-quarter increase. Given that the rise in dollar value was solidly higher than the rise in participation, it indicates those who are buying back shares have accelerated their dollar value in Q4’21. The participation rate is the highest level since Q1’20, when nearly 1400 companies bought back stock and is in-line with the participation rates from 2019 before the pandemic set in.
2021 Stock Buyback Trends By Index & Sector
| Index/Sector | Q4’20 | Q1’21 | Q2’21 | Q3’21 | Q4’21 | QoQ Change | YoY Change |
| All U.S. Companies | $137.7 | $189.7 | $223.6 | $262.7 | $289.8 | 10.3% | 110.5% |
| S&P 500 | $116.7 | $168.4 | $193.9 | $224.3 | $244.1 | 8.8% | 109.1% |
| Russell 2000 | $5.8 | $5.1 | $9.9 | $14.2 | $16.6 | 17.0% | 186.7% |
| Technology | $61.2 | $75.1 | $85.3 | $96.0 | $100.8 | 5.0% | 64.8% |
| Financial | $16.7 | $39.1 | $53.1 | $71.3 | $62.9 | -11.7% | 275.7% |
| Consumer Discretionary | $21.7 | $24.8 | $29.6 | $32.4 | $42.5 | 31.2% | 96.3% |
| Industrial Goods | $9.4 | $14.4 | $16.8 | $19.9 | $21.7 | 9.1% | 130.6% |
| Healthcare | $15.0 | $18.3 | $18.4 | $16.2 | $21.2 | 30.6% | 40.7% |
| Consumer Staples | $8.8 | $12.2 | $10.4 | $11.2 | $14.8 | 32.3% | 69.1% |
| Materials | $1.9 | $3.6 | $5.5 | $7.3 | $11.4 | 56.0% | 488.4% |
| Energy | $0.5 | $0.8 | $3.2 | $4.9 | $10.1 | 107.2% | 1783.5% |
| Real Estate | $1.1 | $1.0 | $1.0 | $1.9 | $2.2 | 11.2% | 94.8% |
| Utilities | $0.7 | $0.2 | $0.0 | $0.3 | $1.6 | 349.8% | 115.2% |
| Telecommunications | $0.5 | $0.2 | $0.1 | $1.1 | $0.6 | -48.5% | 7.4% |
2022 Look Ahead
Here is what we might expect in 2022 based on data from ASRs and buyback authorizations.
High Breadth of Q4’21 Authorizations Comes With High Dollar Value
427 companies initiated or increased buyback plans in Q4’21, an elevated amount. The total dollar value of those new plans was equal to $393.5B, the highest dollar value authorized by companies since $439.3B in Q2’18. The amount and dollar value of new buyback plans is also elevated so far in Q1’22 but doesn’t appear on track to beat out Q4’21.
Dollar Value of Q1’22 ASRs Already Record Highest
The 36 ASRs by companies so far in Q1’22 is good for $39.8B, as of March 14. The number of companies using ASRs is the highest since Q4’18 and the dollar value is the highest ever Q1’19. Most companies disclose ASRs upon entering into the deal, but some, such as Apple (AAPL), report the ASR after the fact so the Q1’22 volume will continue to grow. This quarter’s largest ASR is by S&P Global (SPGI) who had pent up cash after a merger stalled buybacks.
Recent Activity Signals Yet Another Record
Throughout 2021, Russell 3000 companies spent $936B on buybacks, which is 5% higher than the previous peak $890B in 2018. The two years after 2018 were progressively smaller. The volume of buyback plan authorizations in recent months and ASRs of late indicates companies could be equally or more aggressive in 2022, and especially in Q1’22.
About the Data
InsiderScore tracks all open buyback plans that are publicly disclosed by U.S.-listed companies. Quarterly buyback updates are typically included in 10-Qs and 10-Ks, and we capture buying that is part of the publicly announced plan.
Data includes accelerated share repurchases (“ASRs”) and tender offers. Buybacks for the purpose of M&A (exchange offers and tender offers specifically to acquire a company) are excluded. For companies that do not report on a normal calendar basis, we’ve done our best to estimate the most appropriate corresponding calendar period.
Is It Time to Upgrade Your Insider Intel?
Generate differentiated ideas and manage risk with access to regular research reports and powerful insider data & analytics from InsiderScore.


Outperformance Starts Here
See how Verity accelerates winning investment decisions for the world's leading asset managers.
Request a Demo