
Analysis from the VerityData research team examining Q1 2022 ATM stock offerings at U.S. companies.
In this article, featuring macro-level highlights of a Q1 2022 At-the-Market Offerings report from VerityData | InsiderScore, we examine quarterly ATM data and identify relevant market, index, and sector trends. Note: This article is an excerpt of an exclusive report for VerityData | InsiderScore customers.
Want access to insider research reports, data, and analytics?
Request VerityData Trial >>
Q1 2022 saw continued decreases across a range of metrics we track.
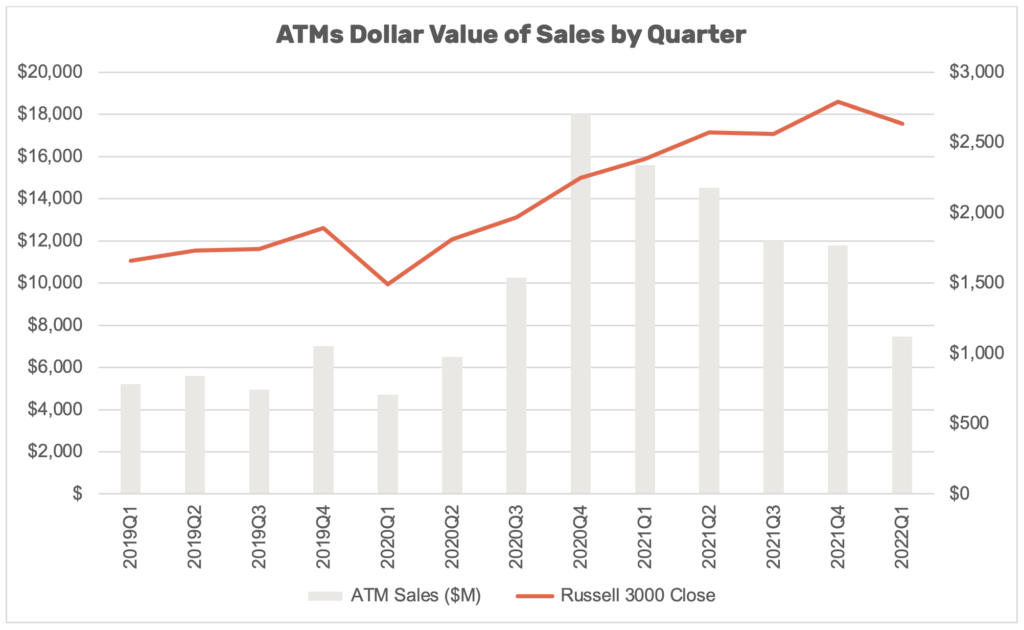
Source: VerityData
ATM volume at U.S. companies in Q1’22 was $7.5B, a -36.7% sequential decline and a -52.1% year-over-year decline. After an all-time high of quarterly ATM volume of $18.0B in Q4’20, overall ATM volume has steadily decreased in five straight quarters. Q1’22 volume is now just slightly above the amounts seen prior to 2020 when ATM use soared.
A total of 220 companies utilized ATMs in Q1’22, a decrease of -19.7% from the 274 that sold shares pursuant to ATM programs in Q4’21. The record breadth of 307 unique companies was set in Q1’21. The Q1’22 figure is a -28.3% decrease YoY from that record. The 2019 average was 182 companies per quarter.
87 plan initiations and increases significantly lower than Q4’21. 70 companies initiated new ATM programs while another 17 increased existing programs. The combined figure of 87 is -31.5% lower than the prior quarter and -53.0% lower than the combined amount of companies who increased or initiated ATMs in Q1’21. The market-wide record of 185 was set in Q1’21 and the average from 2019 was 78.
Companies that executed the largest ATMs by dollar value were Realty Income (O) – $660M; Atmos Energy (ATO) – $500M; Rexford Industrial (REXR) – $410M; Alexandria Real Estate (ARE) – $350M; and Ares Capital (ARCC) – $274M.
The largest dollar value increases occurred in Materials and Energy sectors. Real Estate, Technology sectors drag overall values lower.
| Index/Sector | Q1’21 | Q2’21 | Q3’21 | Q4’21 | Q1’22 | QoQ Change | YoY Change |
| All U.S. Companies | $15,529.2 | $14,504.1 | $11,999.8 | $11,763.4 | $7,456.7 | -36.6% | -52.0% |
| Real Estate | $3,994.5 | $6,639.7 | $6,836.8 | $5,790.9 | $3,217.7 | -44.4% | -19.4% |
| Healthcare | $4,246.8 | $1,776.2 | $1,431.1 | $1,490.6 | $1,136.0 | -23.8% | -73.2% |
| Financial | $574.9 | $661.6 | $491.4 | $871.7 | $872.8 | 0.1% | 51.8% |
| Utilities | $531.4 | $697.8 | $1,026.1 | $1,135.7 | $734.5 | -35.3% | 38.2% |
| Energy | $426.5 | $791.2 | $320.6 | $413.2 | $633.0 | 53.2% | 48.4% |
| Materials | $32.7 | $37.2 | $25.6 | $9.2 | $244.9 | 2565.0% | 649.6% |
| Consumer Discretionary | $1,941.2 | $2,725.7 | $126.9 | $116.3 | $242.6 | 108.5% | -87.5% |
| Industrial Goods | $2,656.0 | $734.4 | $999.5 | $72.1 | $240.3 | 233.5% | -91.0% |
| Consumer Staples | $179.0 | $5.4 | $2.5 | $3.8 | $116.6 | 2969.3% | -34.8% |
| Technology | $914.9 | $427.2 | $733.8 | $1,846.3 | $11.4 | -99.4% | -98.8% |
| Telecommunications | $31.2 | $7.6 | $5.5 | $13.6 | $7.0 | -48.8% | -77.7% |
VerityData captures ATM activity disclosed within 10-Ks, 10-Qs, as well as updates provided in 8-Ks and prospectus filings. Calendar Q4’21 ATM data may not reflect all activity due to fiscal calendars used by some corporations. Situations where ATM sales aren’t granular and cover two or more quarters are recorded in the more recent quarter (ex. ATM sales from “December 2021 to January 2022” are accounted for in Q1’22).
Generate differentiated ideas and manage risk with access to regular research reports and powerful insider data & analytics from VerityData.

See how Verity accelerates winning investment decisions for the world's leading asset managers.
Request a Demo