The Insider Review | July 2022
A monthly summary of notable insider trading activities from Verity’s Director of Research.
In Brief
- Insiders took their foot off the gas in June, but low selling volume is a good sign.
- This has a few potential impacts heading into earnings season.
- Charts showing unique buyers and sellers since 2015 provides context.
Macro: Insiders Took Foot Off the Gas, But Low Selling Volume Is Good Sign
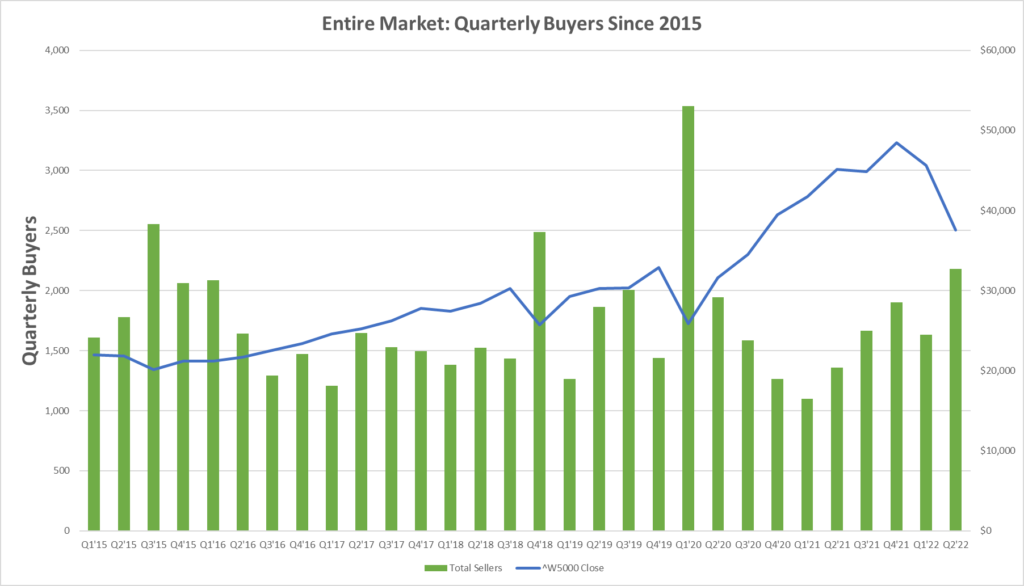
First, the bad news: An insider buying binge that began in May fizzled out in June, with the number of buyers falling from ~1,400 to ~800.
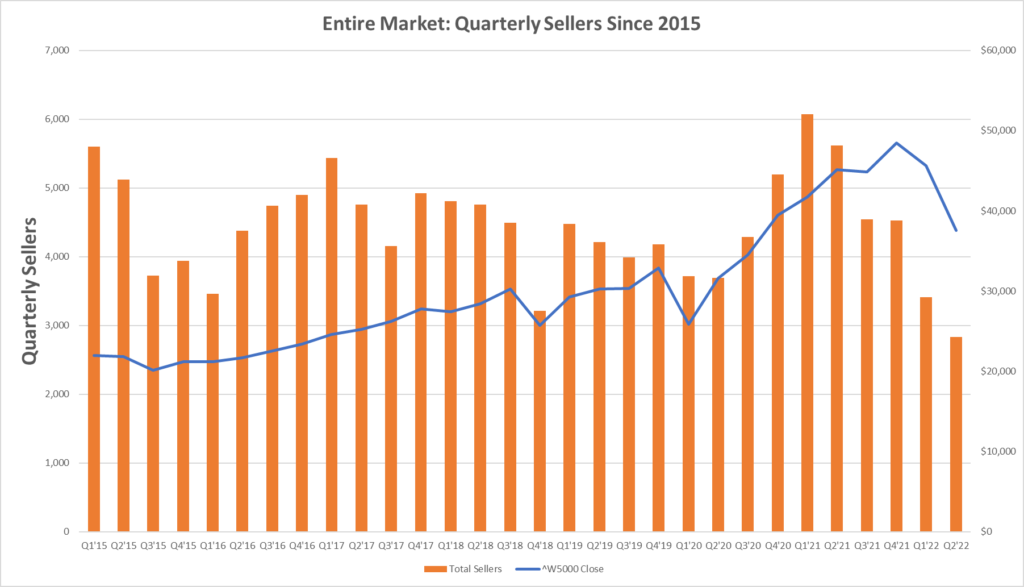
Now, the good news: When June wrapped, so did Q2’22, and when the smoke cleared a total of ~2,800 insiders had sold stock during the quarter.
That may sound like a lot of executives and board members selling stock but it’s the third-lowest number of unique sellers in a quarter since our data set began in Q1’04. The only quarters with fewer sellers were Q4’08 (~2,300 sellers) and Q1’09 (~1,900 sellers).
Q4’08 was a good quarter for stocks, but the bottom just ahead of the 2008 election that preceded a year-end rally proved to be false as stocks began tumbling as soon as the calendar flipped to 2009. The market sunk during the first two months of Q1’09, then found its multi-year bottom in early March as insider buying breadth and volume surged to historic highs.
What Does This Mean Heading Into Earnings Season?
Next, the question: What does this mean heading into Q2’22 earnings season? The lack of follow-through while market volatility continued in June suggests insiders feel that investors are not prepared to reward generally strong Q1’22 earnings and generally stable Q2’22 and 2H’22 outlooks. Conversely, the dearth of selling suggests that insiders are unwilling to seek liquidity at current prices because they believe stocks are not being fairly valued.
Insiders are unique market participants because no one else receives $0 cost basis stock and/or stock options. This leads to a willingness to take a longer-term approach to managing what, for most of them, will be their largest asset (stock in their employee). While high buy volume has historically been a good indicator of market inflections, instances of low sell volume have also been timely as well. The difference in the behaviors is that buying is convicted, while low sell breadth and volume is cautiously bullish and potentially a sign that insiders are confused by how investors are reacting to actual operational performance.
The charts below examine unique quarterly sellers and buyers since 2015.
Quarterly Sellers Since 2015

Quarterly Buyers Since 2015

About the Data
Data included in this report is sourced by VerityData’s comprehensive databases of insider trades, buybacks, at-the-market offerings, management changes, institutional investor disclosures, and more.
For access, request a free trial of VerityData >>
For data inquiries relevant to this report, contact Ben Silverman.


Outperformance Starts Here
See how Verity accelerates winning investment decisions for the world's leading asset managers.
Request a Demo