

Analysis from VerityData examining Q3'26 insider buying and selling at U.S. companies.
In this article, featuring highlights from the VerityData Q3’26 U.S. Insider Activity Review, we examine quarterly insider transaction data and identify market and sector trends in insider buying and selling. Note: This article is an excerpt of an exclusive report for VerityData customers. Data compiled October 2026.
Market-wide insider buying fell 18% in Q3’26, to 1,290 buyers from 1,580 in Q2’26. Sellers totaled 4,382, down from 4,559.
The market-wide Unique Seller to Unique Buyer Ratio climbed to 3.40x in Q3’26 from 2.89x in Q2’26, ranking in the 72nd percentile of readings since 2004 and 1.22 times the long-run average of 2.79x.
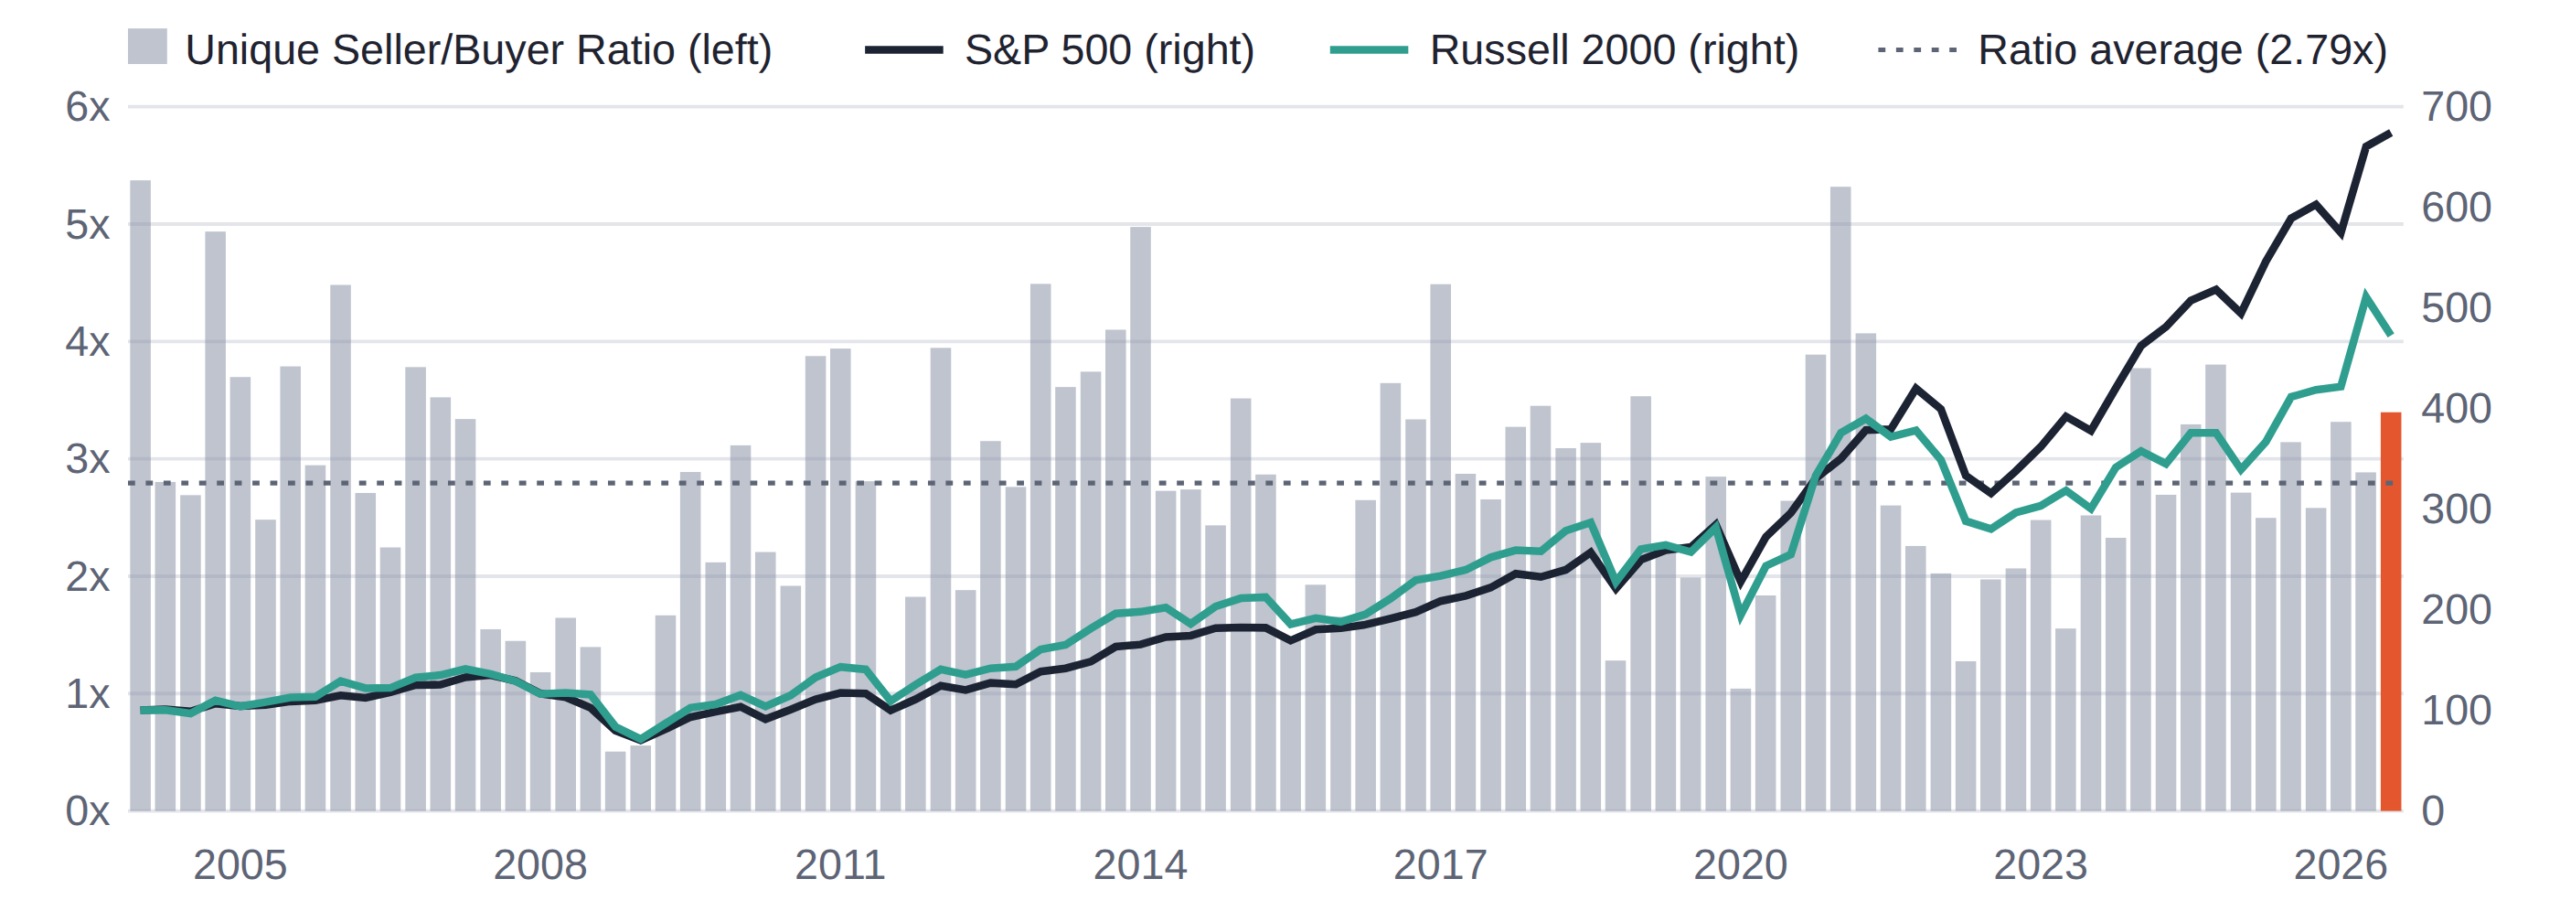
Quarterly Unique Seller/Buyer Ratio for all U.S. companies from Q1’04 to Q3’26, with the S&P 500 and Russell 2000 (tracked by SPY and IWM, indexed to 100 at Q1’04). Source: VerityData
Four sectors read above their long-run averages in Q3’26: Financial, Energy, Tech + Telecom and Healthcare. Consumer Staples, Utilities and Materials read well below.
| Unique Seller/Buyer Ratio | Q3'25 | Q4'25 | Q1'26 | Q2'26 | Q3'26 | Hist. avg | × avg |
|---|---|---|---|---|---|---|---|
| Financial | 1.65x | 1.23x | 1.75x | 1.84x | 2.51x | 1.20x | 2.10 |
| Energy | 1.41x | 1.45x | 5.76x | 2.20x | 3.15x | 2.29x | 1.38 |
| Tech + Telecom | 8.92x | 6.45x | 6.15x | 7.48x | 8.07x | 6.51x | 1.24 |
| Entire Market | 3.14x | 2.58x | 3.31x | 2.89x | 3.40x | 2.79x | 1.22 |
| Healthcare | 2.27x | 2.96x | 2.67x | 2.73x | 3.12x | 3.05x | 1.02 |
| Real Estate | 1.94x | 0.96x | 2.21x | 1.33x | 1.48x | 1.68x | 0.88 |
| Industrials | 5.11x | 2.90x | 4.66x | 2.77x | 3.63x | 4.38x | 0.83 |
| Consumer Discretionary | 3.96x | 2.52x | 4.06x | 2.72x | 3.16x | 4.09x | 0.77 |
| Materials | 1.75x | 2.04x | 2.15x | 1.70x | 1.59x | 2.80x | 0.57 |
| Utilities | 5.73x | 7.75x | 6.71x | 3.26x | 2.29x | 4.26x | 0.54 |
| Consumer Staples | 2.78x | 1.78x | 2.83x | 1.56x | 2.06x | 4.04x | 0.51 |
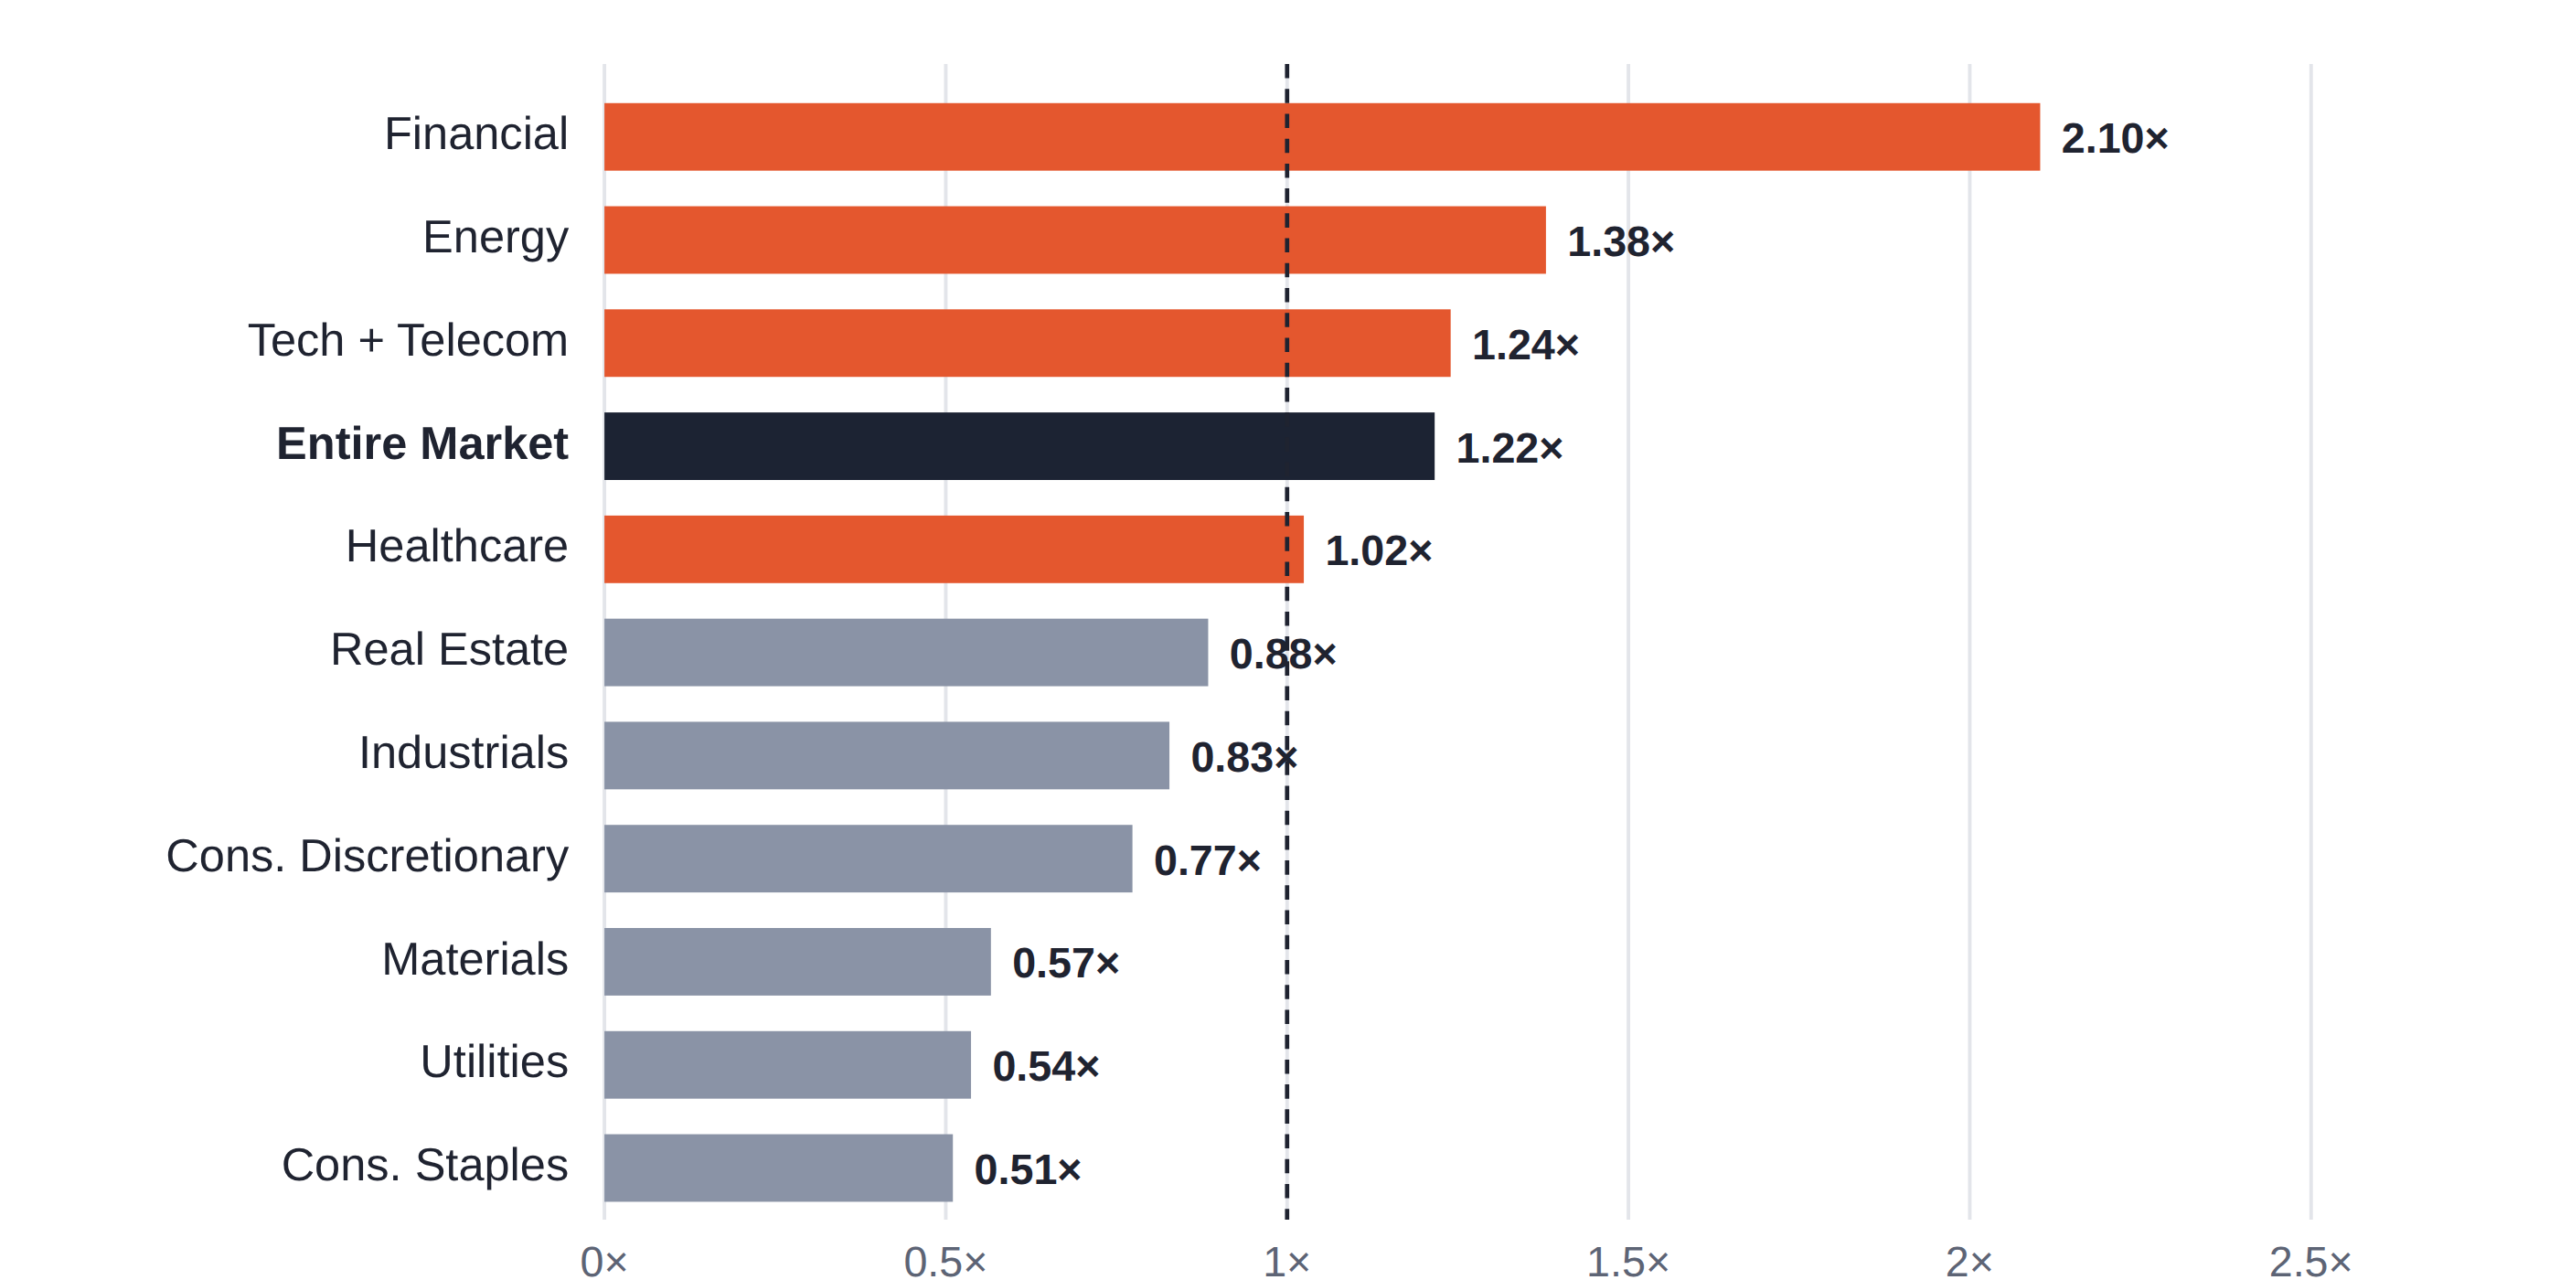
Q3’26 Unique Seller/Buyer Ratio as a multiple of each sector’s Q1’04–Q2’26 average. Source: VerityData
Only 298 unique Financial-sector insiders bought stock in Q3’26, the fewest in 91 quarters of VerityData records and just below the prior low of 302 in Q3’24. Sellers, at 749, were elevated but not unusual. The sector’s Unique Seller/Buyer Ratio reached 2.51x, 2.1 times its 22-year average and the fourth-highest reading on record, behind only Q1’17 (3.16x), Q4’16 (3.06x) and Q4’24 (2.63x).
Those three quarters came during post-election bank rallies, and XLF kept rising. In all five quarters when the Financial ratio reached 2.3x or higher, XLF gained over the following year and beat the Wilshire 5000 in four. Heavy Financial insider selling has not reliably marked tops.
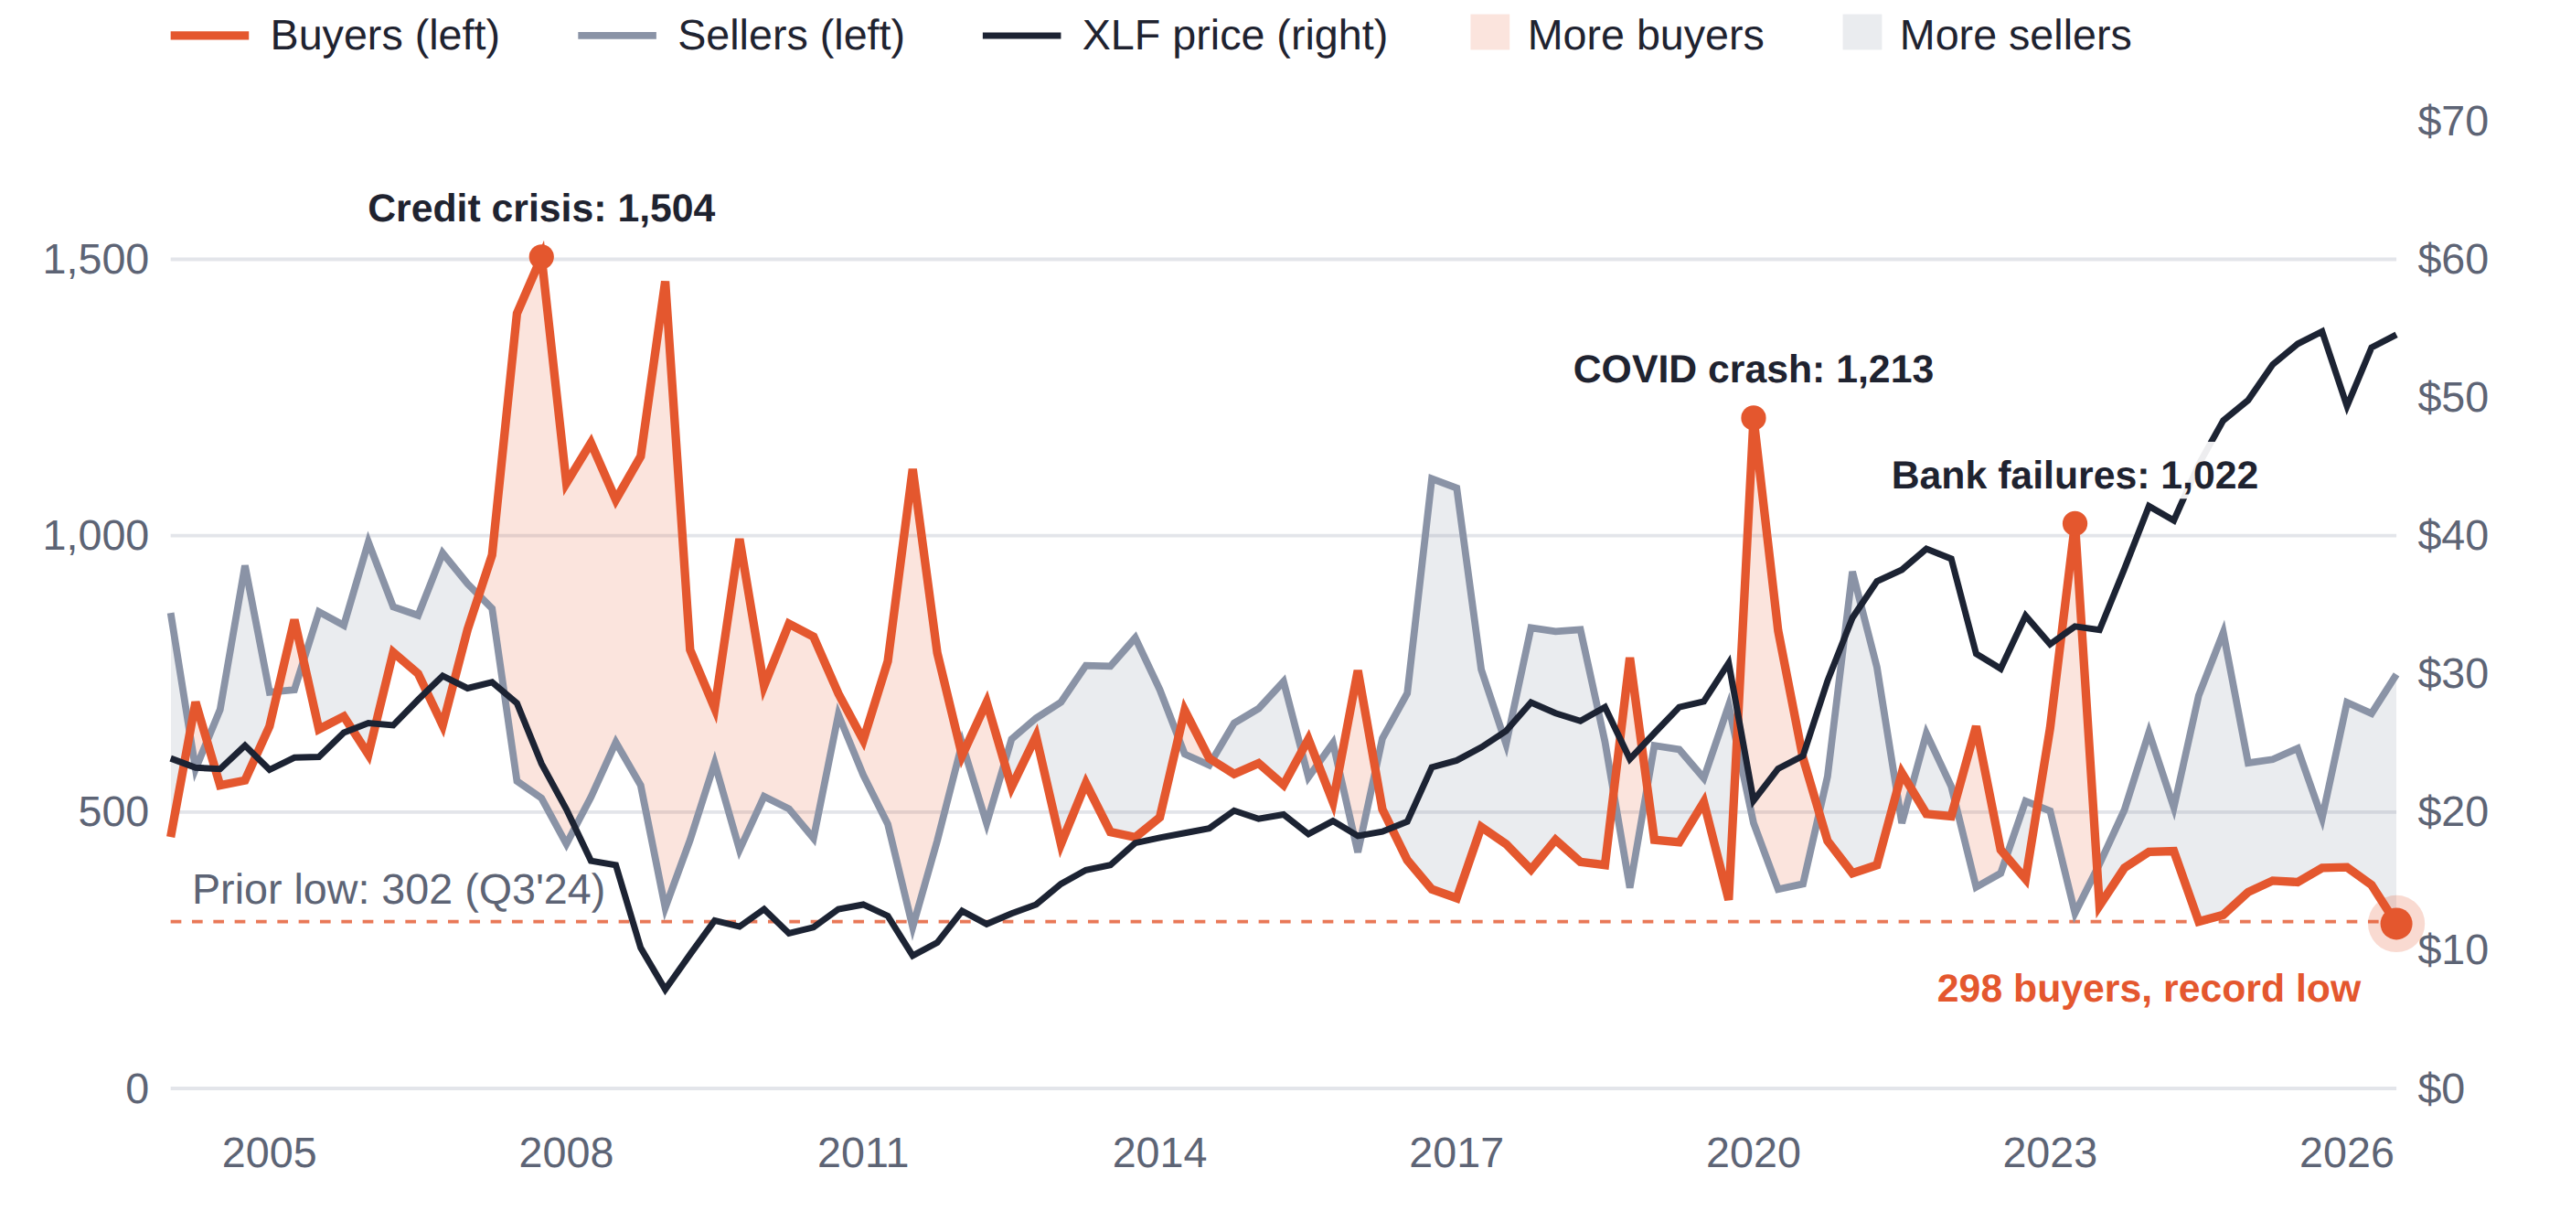
Unique insider buyers and sellers in the Financial sector by quarter from Q1’04 to Q3’26, with the XLF quarter-end price. Source: VerityData
Energy’s Unique Seller/Buyer Ratio fell from 5.76x in Q1’26, the broadest selling in 15 years, to 2.20x in Q2’26, then rose to 3.15x in Q3’26. IYE dropped 12.6% in Q2’26 and then made it all back in Q3’26, up 16.6%. Insiders used the recovery to sell again, led by refiners trading near record margins.
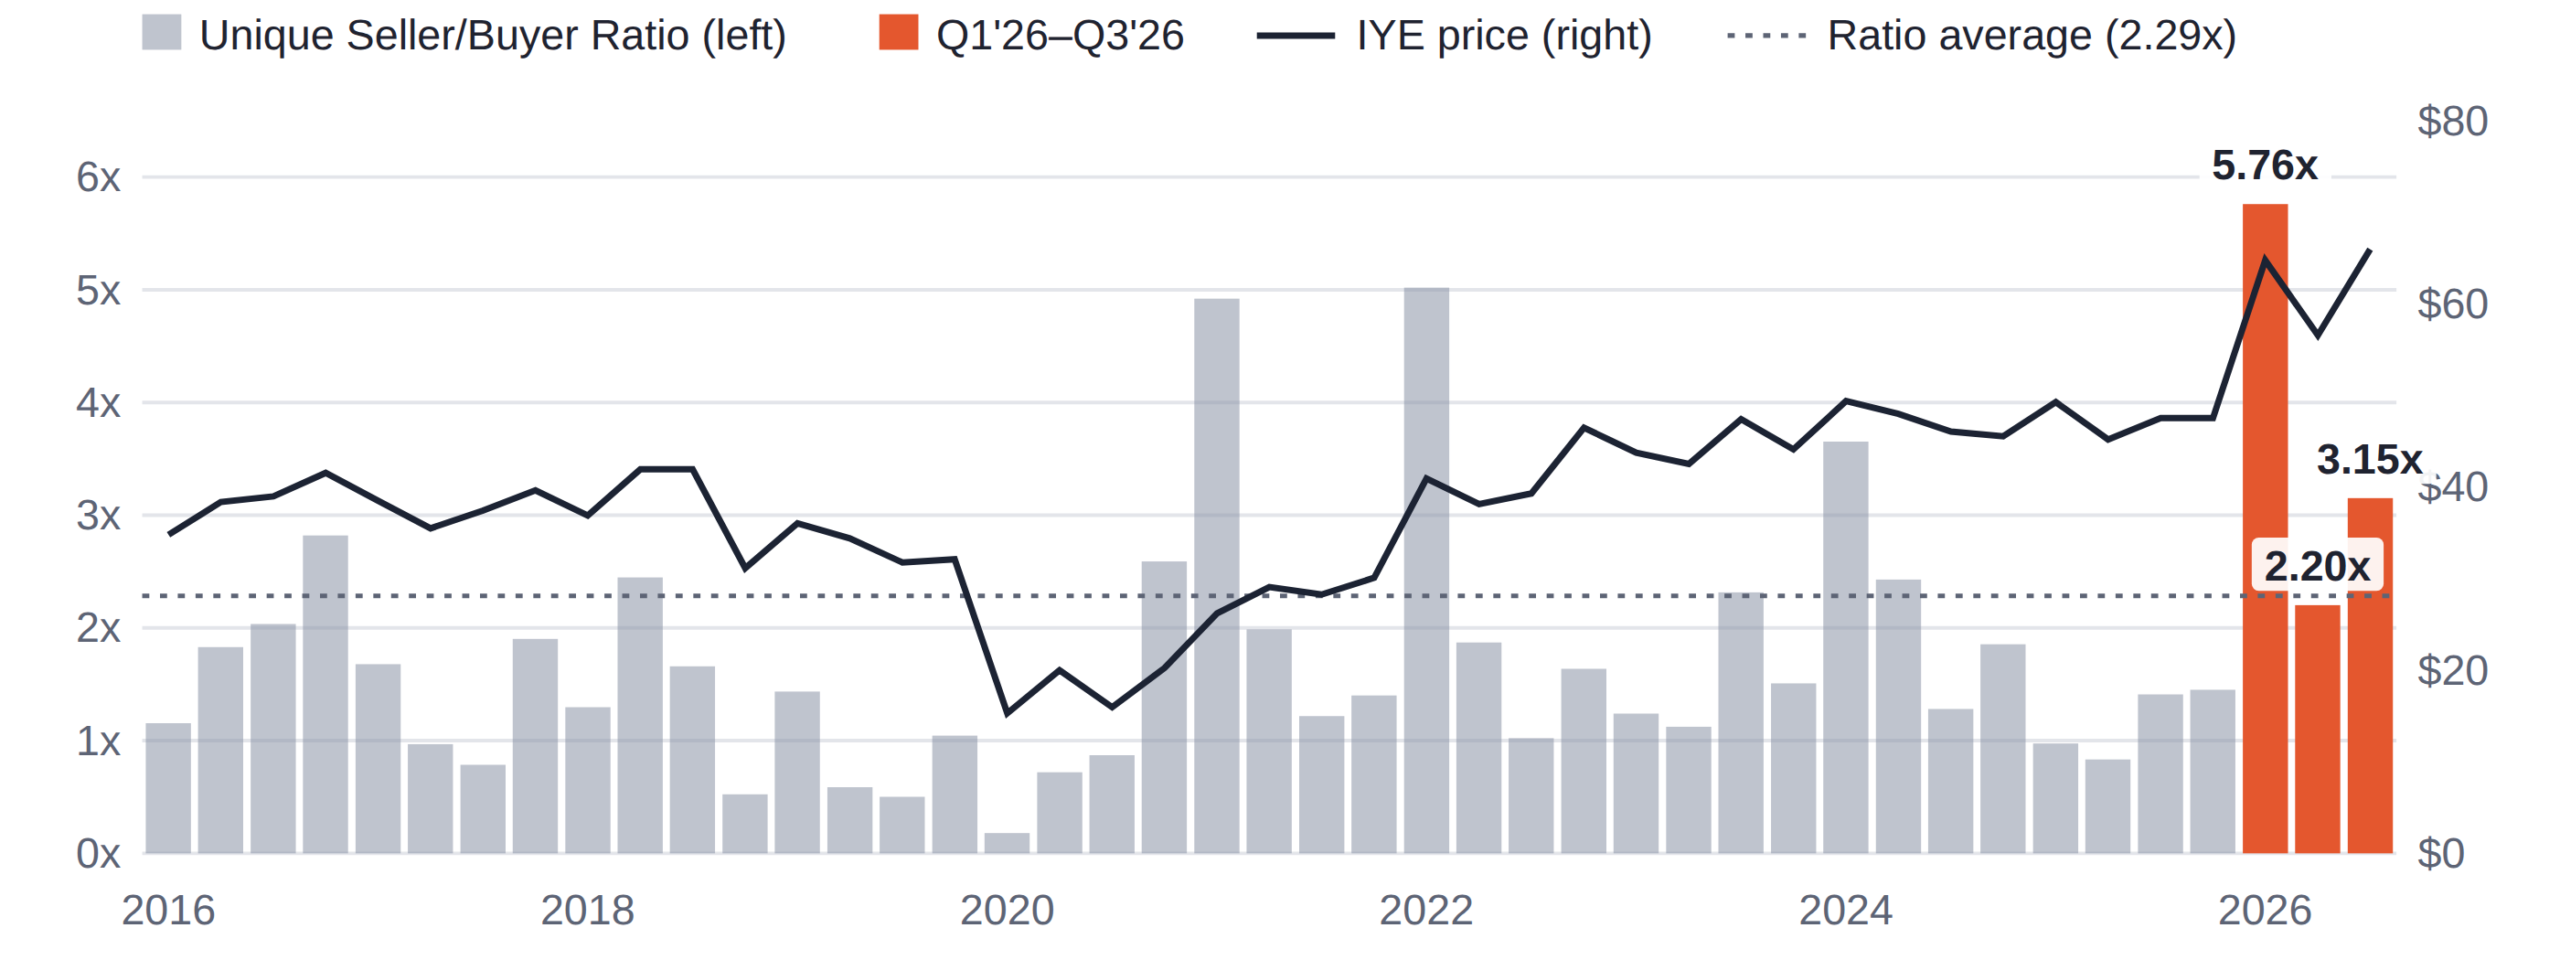
Energy Unique Seller/Buyer Ratio by quarter from Q1’16 to Q3’26, with the IYE quarter-end price. Source: VerityData
Bank earnings under a Fed that is raising rates again. The Fed raised rates to 3.75%–4.00% in September, its first hike since 2023, while Financial insiders bought less than in any quarter on record. The big banks report October 13–14, after Bank of America’s CEO said Q3’26 trading revenue would be roughly flat year over year, well below Q2’26’s record. Bank stocks are down more than 13% from their mid-August peak. If Financial insiders keep showing a stronger-than-normal sell bias after windows reopen, the rate turn worries them more than prices reflect.
Refiners after the margin peak. The 3-2-1 crack spread fell to $64.65 on October 4 from $75.24 on October 1, after the G7 agreed to release 100 million barrels of reserves and Trump ruled out a U.S. diesel export ban. Refiner insiders sold into record margins in Q1’26 and Q3’26. A reopened Strait of Hormuz would narrow margins further, but Iran says it stays shut until its conditions are met.
Defensive sectors against rising yields. Utilities and Staples insiders sold far less than usual in Q3’26 (0.54 and 0.51 times average). With the 2-year yield at 4.78%–4.92% over the past week, the 10-year at its highest since 2002 and futures pricing three more hikes by mid-2027, watch whether those insiders keep buying if yields climb further.
VerityData tracks every Form 3, 4 and 5 filed by insiders at U.S. companies. The Unique Seller/Buyer Ratio divides the number of unique insiders who sold stock in a quarter by the number who bought. Historical averages and percentiles cover Q1’04–Q2’26. Index and ETF prices are quarter-end closes, price only.

Generate differentiated ideas and manage risk with access to regular research reports and powerful insider data & analytics from VerityData.
Get Your Free VerityData Trial