
Analysis from the VerityData research team examining ATM stock offerings at U.S. companies.
In this article, featuring macro-level highlights of an At-the-Market Offerings report from VerityData | InsiderScore, we examine quarterly ATM data and identify relevant market, index, and sector trends. Note: This article is an excerpt of an exclusive report for VerityData | InsiderScore customers.
Want access to insider research reports, data, and analytics?
Request VerityData Trial >>
ATMs are sales agreements between public companies and broker-dealers that allow the latter to sell shares of the company on the open market over a set period or in an open-ended manner.
Most ATMs involve common shares, but companies can sell preferred stock and debt instruments as well. ATMs allow companies to raise capital by selling equity on the open market.
ATMs can be opportunistic. Companies may opportunistically time the execution of ATM programs, increasing sales amid stock rallies and pulling back when rallies fade or reverse.
ATMs can help companies quickly, quietly, and cheaply raise capital. ATMs are often overlooked by Wall Street, generating less attention compared to other stock offering methods. Underwriting fees are also less expensive for ATMs at about 2% – 3% compared to secondary offerings that include underwriting discounts of 5% or more. ATM sales can be quick or methodical, and companies may choose not to execute on any authorizations.
Q4 ’21 saw decreases across a range of metrics we track. Largest ATMs were Realty Income (O) – $1.7B; MicroStrategy (MSTR) – $596M; and Riot Blockchain (RIOT).
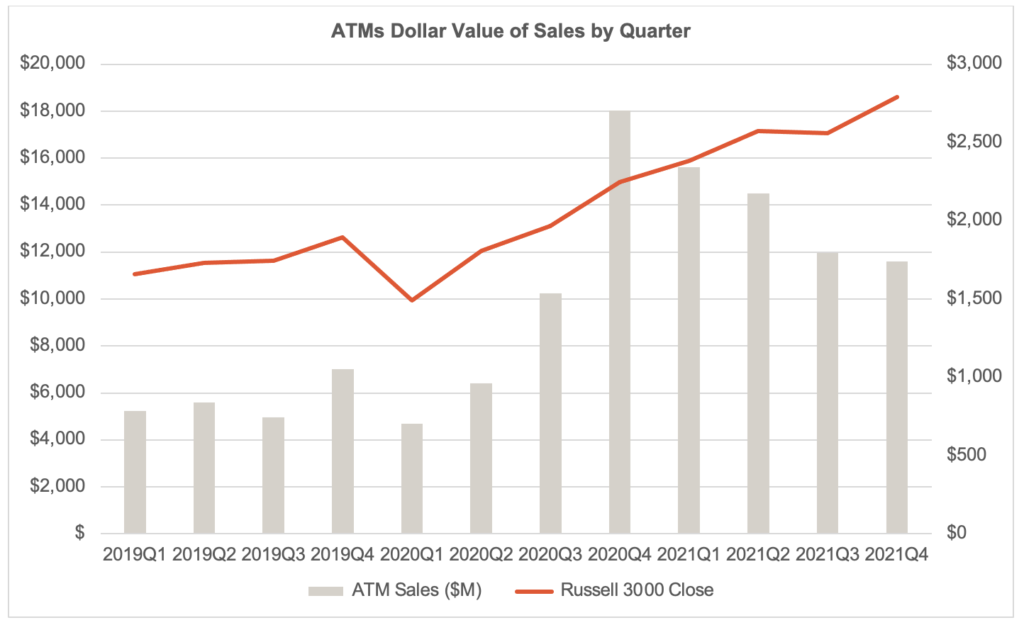
ATM sales declined QoQ throughout 2021. Source: VerityData
ATM volume at U.S. companies in Q4’21 was $11.6B, a -2.9% sequential decline and a -35.7% year-over-year decline. After an all-time high of quarterly ATM volume of $18.0B in Q4’20, overall ATM volume has steadily decreased in four straight quarters. Despite that, Q4’21 volume remains solidly above the amounts seen prior to 2020.
A total of 238 companies utilized ATMs in Q4’21, a decrease of -13.8% from the 276 that sold shares pursuant to ATM programs in Q3’21. The record breadth of 307 unique companies was set in Q1’21. The Q3’21 figure is a -10.9% decrease YoY when 267 companies sold using ATM programs in Q4’20. The 2019 average was 182 companies per quarter.
106 companies initiated new ATM programs while another 20 increased existing programs. The combined figure of 126 is -26.7% lower than the prior quarter and -13.1% lower than the combined amount of companies who increased or initiated ATMs in Q4’20. The record of 186 was set in Q1’21 and the average from 2019 was 78.
Companies that executed the largest ATMs by dollar value were Realty Income (O) – $1.7B; MicroStrategy (MSTR) – $596M; Riot Blockchain (RIOT) – $564M; Equinix (EQIX) – $398M; and Welltower (WELL) – $398M.
The largest dollar value increases occurred in Technology, Financial sectors. Real Estate, Industrial Goods sectors drag overall values lower.
| Index/Sector | Q4’20 | Q1’21 | Q2’21 | Q3’21 | Q4’21 | QoQ Change | YoY Change |
| All U.S. Companies | $18,023.3 | $15,552.3 | $14,492.6 | $11,940.1 | $11,587.6 | -3.0% | -35.7% |
| Real Estate | $4,255.8 | $4,017.6 | $6,628.2 | $6,867.4 | $5,764.7 | -16.1% | 35.5% |
| Technology | $426.7 | $914.9 | $427.2 | $733.7 | $1,846.8 | 151.7% | 332.8% |
| Healthcare | $2,656.9 | $4,246.8 | $1,776.2 | $1,392.3 | $1,451.1 | 4.2% | -45.4% |
| Utilities | $213.0 | $531.4 | $697.8 | $974.6 | $1,057.5 | 8.5% | 396.4% |
| Financial | $367.1 | $574.9 | $661.6 | $491.4 | $862.8 | 75.6% | 135.0% |
| Energy | $102.8 | $426.5 | $791.2 | $320.6 | $413.0 | 28.8% | 301.8% |
| Consumer Discretionary | $8,682.3 | $1,941.2 | $2,725.7 | $126.9 | $111.9 | -11.9% | -98.7% |
| Industrial Goods | $1,275.6 | $2,656.0 | $734.4 | $999.5 | $53.5 | -94.6% | -95.8% |
| Telecommunications | $20.5 | $31.2 | $7.6 | $5.5 | $13.6 | 145.0% | -33.7% |
| Materials | $20.9 | $32.7 | $37.2 | $25.6 | $9.0 | -64.7% | -56.9% |
| Consumer Staples | $1.5 | $179.0 | $5.4 | $2.5 | $3.7 | 47.8% | 146.7% |
VerityData captures ATM activity disclosed within 10-Ks, 10-Qs, as well as updates provided in 8-Ks and prospectus filings. Calendar Q4’21 ATM data may not reflect all activity due to fiscal calendars used by some corporations. Situations where ATM sales aren’t granular and cover two or more quarters are recorded in the more recent quarter (ex. ATM sales from “December 2021 to January 2022” are accounted for in Q1’22).
Generate differentiated ideas and manage risk with access to regular research reports and powerful insider data & analytics from VerityData.

See how Verity accelerates winning investment decisions for the world's leading asset managers.
Request a Demo