
Analysis from VerityData examining Q1 2023 corporate share buyback trends at U.S. companies.
In this article, featuring highlights of a Buyback Trends report from VerityData | InsiderScore, we examine quarterly buyback data and identify market, index, and sector trends related to corporate stock repurchases. Note: This article is an excerpt of an exclusive report for VerityData | InsiderScore customers. Data compiled June 5, 2023.
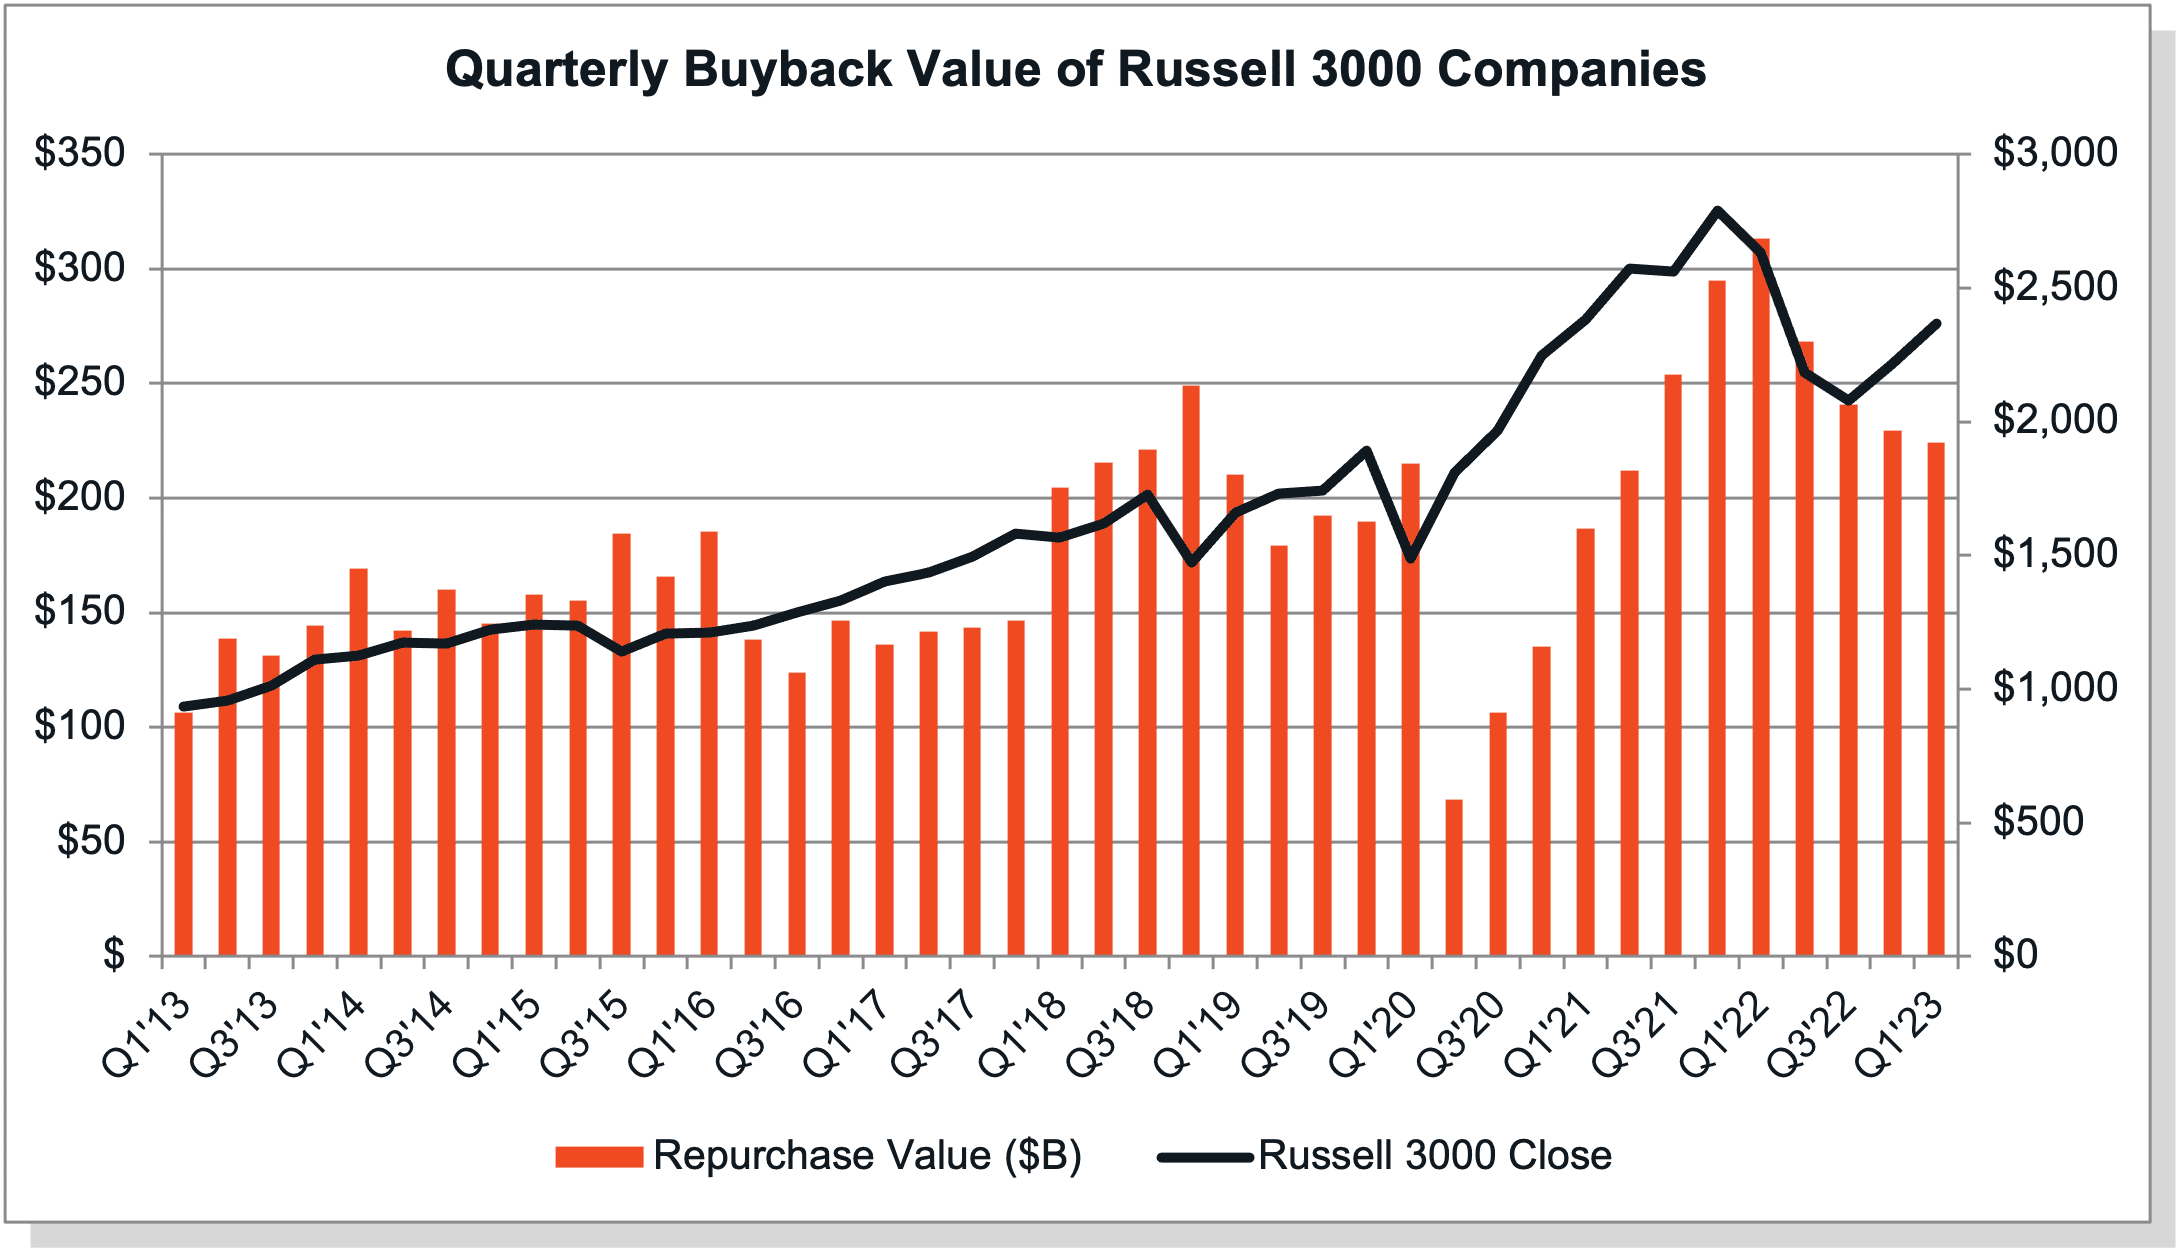
Buyback volume for U.S. companies in Q1’23 totaled $225.6B, representing a -3.4% sequential decrease from the prior quarter and a -28.8% YoY drop. The slight decrease in volume in Q1’23 extends a multi-quarter run of decreasing volume since Q1’22 when buyback volume was at an all-time high. Considering the small dip in Q1’23, it appears the market for repurchases may have found a near-term bottom.
A total of 1,070 companies reported repurchases for Q1’23 so far, which compares to an average of 1,026 companies per quarter over the last 10 years. The breadth of buybacks reached unusually high levels in Q2’22 (even though the dollar value dipped that quarter) and has since declined, with Q1’23 -6.6% below Q4’22. We note that not all companies have reported Q1’23 data yet, particularly those with offset fiscal calendars, so the number of companies buying back will settle at a slightly higher level. That also means the dollar volume will similarly increase slightly and may end up quite close to Q4’22.
A total of 171 companies initiated new buyback plans in Q1’23 and another 82 increased existing plans. The combined figure of 253 is below the Q4’22 count of 357 and below average.
The Inflation Reduction Act that was signed into law in August 2022 includes a 1% excise tax on buybacks that began in 2023. At 1%, the willingness and calculation of whether to buy back shares likely only minimally changed. That’s transpired into similar buyback volume in Q1’23 as compared to Q4’22, the last quarter before the tax was implemented. It was also clear companies didn’t opt to front-load Q1’23 buybacks into Q4’22.
Source: VerityData
| Q1 ‘22 | Q2 ‘22 | Q3 ‘22 | Q4 ‘22 | Q1 ‘23 | QoQ Change | YoY Change | |
|---|---|---|---|---|---|---|---|
| All U.S. Companies | $316.8 | $273.0 | $246.2 | $233.5 | $225.6 | -3.4% | -28.8% |
| S&P 500 | $264.3 | $220.2 | $204.5 | $196.2 | $198.1 | 0.9% | -25.1% |
| Russell 2000 | $16.5 | $18.8 | $11.6 | $10.6 | $11.1 | 4.5% | -32.7% |
| Technology | $100.9 | $95.2 | $86.1 | $78.7 | $77.8 | -1.1% | -22.9% |
| Financial | $61.2 | $34.5 | $30.2 | $27.9 | $41.1 | 47.4% | -32.8% |
| Consumer Discretionary | $49.1 | $43.4 | $36.3 | $32.0 | $29.7 | -7.1% | -39.4% |
| Energy | $11.6 | $22.9 | $27.9 | $24.5 | $22.2 | -9.2% | 92.0% |
| Healthcare | $37.5 | $21.1 | $17.3 | $22.8 | $19.4 | -14.7% | -48.1% |
| Industrial Goods | $28.0 | $25.7 | $23.9 | $26.6 | $16.2 | -39.1% | -42.2% |
| Consumer Staples | $14.4 | $11.7 | $12.1 | $8.1 | $7.4 | -8.1% | -48.5% |
| Telecommunication | $0.9 | $0.9 | $0.8 | $2.7 | $4.9 | 81.4% | 429.2% |
| Materials | $9.5 | $12.7 | $8.9 | $8.4 | $4.4 | -47.6% | -53.2% |
| Utilities | $1.5 | $0.9 | $0.5 | $0.5 | $1.6 | 237.3% | 3.6% |
| Real Estate | $2.3 | $4.0 | $2.1 | $1.4 | $0.7 | -49.4% | -69.7% |
Source: VerityData
The leading repurchases in Q1’23 were Apple (AAPL), Alphabet (GOOGL), Meta Platforms (FB), TMobile (TMUS) and Microsoft (MSFT).
Apple (AAPL) topped all companies marketwide, as usual, with $19.1B in buybacks in Q1’23, essentially matching the $19.0B spent in Q4’22.
Alphabet (GOOGL) repurchased $15.0B in Q1’23, in-line with the prior two quarters of $15.4B that were a record for the company.
Meta Platforms (FB) repurchased $9.1B in Q1’23, solidly higher than the prior quarter of $6.9B. The latest quarter compares to a peak of $19.2B in Q4’21.
T-Mobile (TMUS) had the fourth largest buyback market-wide at $4.8B, placing it within the top 10 for the first time. $4.8B is 2X TMUS’ next largest buyback of $2.3B in Q4’22.
Microsoft (MSFT) again bought back $4.6B in Q1’23, matching the prior two quarters. MSFT previously spent $6B or more for every quarter from Q2’21 – Q2’22 so buybacks in the past three quarters is modest. 4.5B in shares. The amount slightly surpasses the $4.0B bought back in Q2’22 and is the highest since 2013.
VerityData tracks all open buyback plans that are publicly disclosed by U.S.-listed companies. Quarterly buyback updates are typically included in 10-Qs and 10-Ks, and we capture buying that is part of the publicly announced plan.
Data includes accelerated share repurchases (“ASRs”) and tender offers. Buybacks for the purpose of M&A (exchange offers and tender offers specifically to acquire a company) are excluded. For companies that do not report on a normal calendar basis, we’ve done our best to estimate the most appropriate corresponding calendar period.
Generate differentiated ideas and manage risk with access to regular research reports and powerful insider data & analytics from VerityData | InsiderScore.

![]()
Ali Ragih, CFA, is a Senior Research Analyst at Verity. He’s passionate about diving into investment data, looking for outliers, and interpreting the signals that fuel better investment decisions. He’s been delivering differentiated research and analysis to asset managers for 10+ years.

See how Verity accelerates winning investment decisions for the world's leading asset managers.
Request a Demo